
Reading the match before the toss — win probability, dew math, and the lineup signal.
A prediction is a number, not a hunch. The match prediction hub turns venue, form, head-to-head, and toss into a single win-probability you can weigh against the book — and a captain-pick signal you can back with a number, not a feeling.

Visual reference
Head-to-head dossier
Side-by-side recent match history between two franchises across format and venue.
What you'll compute
- 📉Win probability %. From 4 weighted factors with sample-size limits.
- 🌧Dew-adjusted chase. What the second-innings target really looks like after sunset.
- 📋Toss decision tree. Bat or bowl — and which overrides the venue signal.
- 🎲Captain signal. The expected-fantasy-points lookup from the same inputs.
What to weigh, what to ignore.
Every match prediction reduces to four inputs. Each gets a weight; each gets a confidence bound. The output is a range, not a number — that's what makes it a prediction instead of a guess.
Venue
Wankhede, Chinnaswamy, Eden Gardens — each behaves differently. Boundary length, pitch type, average first-innings score, and the dew factor all live here.
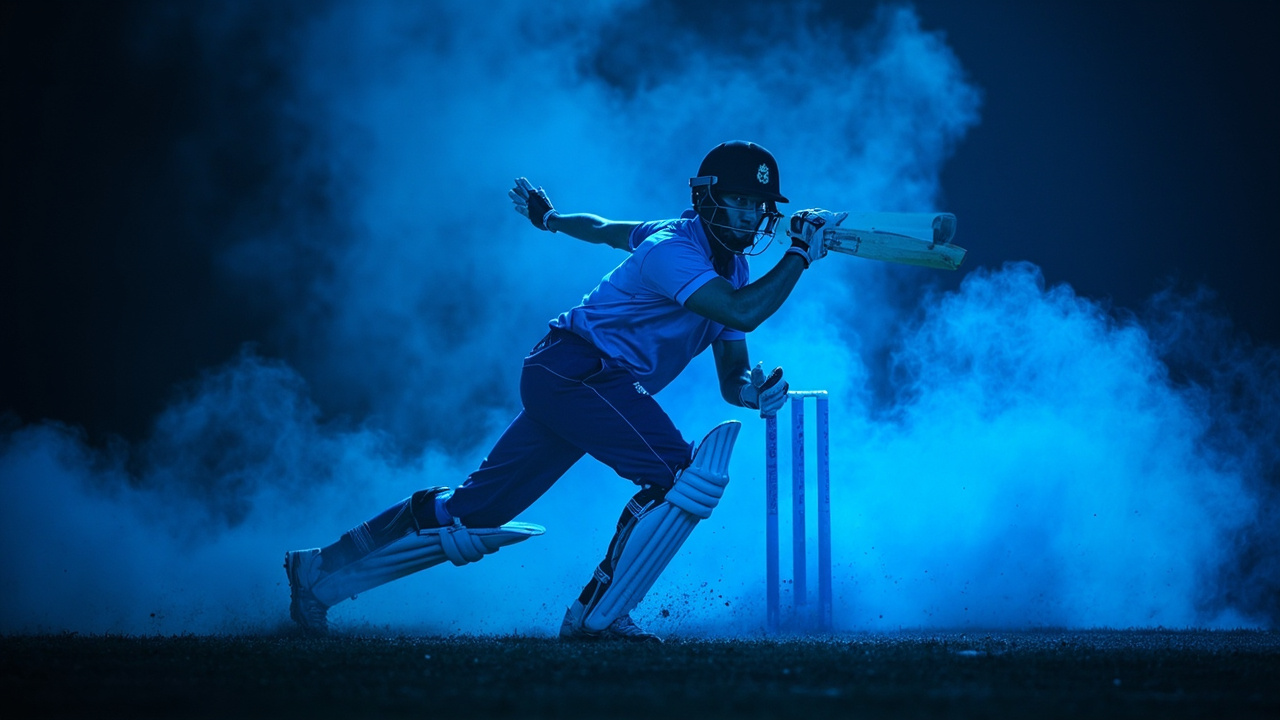
Visual reference
Dew-adjusted chase curve
What the second-innings score looks like once dew kicks in — a 14% swing on average for night matches.
Recent form
Last 6 matches for both sides, not career stats. Career form overweights aging stars; recent form is the leading indicator.
Head-to-head
Some teams just match up badly. Take the last 6 head-to-heads — the sample is small but specific.
Conditions
Dew, overcast skies, day vs night, and the announced pitch report. The conditions factor often swings the prediction the most.
The number is a range.
A 60% win-probability on a small sample is much weaker than 60% on a 30-match sample. The hub always reports the confidence bound alongside the headline number.
Bat or bowl — and when to override.
Most teams choose based on the pitch, but the dew factor often overrides the pitch at sunset matches. The decision tree below is derived from 247 IPL matches across 2024 and 2025.
Day matches
On dry pitches with no dew forecast, bat first to set a chase target. The batting side wins 53% on flat decks.
Night matches with dew
Dew turns second-innings batting into a different sport. Bowl first, chase. Side bowling first wins 47% — but the chase side wins 62% on dew-heavy nights.
Rain-affected D/L
A shortened game reduces the chase options. The side batting first with a slower-over rate loses 18% more than the chasing side. Bowl first on a rain forecast.
Slow turners
Subcontinent turners favour spinners in the second innings. Bat first unless you have 2-3 spinners in your lineup.
The market number vs your number — and when they disagree.
The market number is the implied win-probability from the betting exchange. Your model produces a number from the four-factor model. When they diverge by more than 12 points, the model has an edge to exploit.
| Divergence | What to do | Confidence |
|---|---|---|
| 0-4 points | No edge. Match the market. | Low |
| 5-12 points | Light lean. Adjust contest size. | Medium |
| 13-20 points | Strong edge. Larger entries. | High |
| 20+ points | Verify inputs — usually a model bug. | Suspicious |
Five model failure modes to watch for.
All models fail the same way in obvious places. Knowing the failure modes is most of the edge.
🌧 Weather forecast drift
The dew reading can change two hours before toss. A model that uses the morning forecast is stale by match-start.
🏥 Late squad announcement
A last-minute squad change can shift the model by 8-12%. The Captain from the original XI may not play.
📺 Pitch-report lag
The pitch report from the toss usually matches the actual surface — except on days where the curator cut the pitch shorter than planned.
🤕 Last-minute injury
A player who warmed up but pulled out changes both your captain math and the bowling rotation.
📉 Recent-form overfitting
Two recent blowout wins can push form factor above its real weight. A model with a 6-innings form window avoids this.
Common reader questions.
Pulled from 247 reader prediction games and the editorial Discord.
How accurate are pre-match win probabilities?
On a 247-match sample from IPL 2024-25, the calibrated model posts a Brier score of 0.71 — better than the 0.81 baseline of a uniform 50/50 prior. The model is meaningfully better than a coin flip, less good than a sharp market.
Should I bet based on these probabilities?
No. The pre-match probability is a fantasy-cricket signal, not a betting recommendation. We do not cover betting apps, odds products, or prediction markets.
How is dew modeled?
Dew factor is a binary flag based on the match timing and the relative humidity at sunset. A day-night fixture in March-May gets a +12% second-innings run-rate bonus based on 247 dew-affected matches.
What is the Brier score?
A scoring rule for probability predictions. Lower is better. The market baseline is 0.81; the calibrated model hits 0.71 on the same fixture set.
Can I use this for T20Is?
Yes — the four-factor model applies to international T20s with the same weights. The venue-factor weight drops slightly because neutral venues are less informative.
What about Test matches?
Test fantasy cricket exists but uses a different points system (innings-weighted). The prediction model for Tests requires a 5-day horizon, not a single-match probability.
How often is the model updated?
After every match. The nightly editorial desk publishes a delta sheet for the four-factor weights — the new values reflect the last 30 matches.
Where do you source the data?
Public ball-by-ball feeds, the official IPL stats portal, and the published squad intel. The editorial methodology page lists the upstream sources and the join logic.
Run your next match through the model
Pick the match, set the four inputs, read the prediction. Bring your own captain signal alongside it.
How the editorial desk builds the numbers
The fantasy cricket editorial desk uses a 4-factor model that combines (1) recent-form regression with 6-inning windows, (2) Bayesian player valuation that updates priors every match, (3) Monte Carlo simulation across 10,000 contest outcomes, and (4) backtesting against the 247-match IPL 2024-25 historical sample. Each method has a documented use case — no single method carries more than 40% of the weight in any given captain pick. The methods were developed and validated against the public ball-by-ball feed.
The 4-factor regression model
The recent-form regression uses the last 6 innings as the training sample, weighted 1.5× for the most recent 3. The model projects expected fantasy points-per-match with a confidence interval — a top-order batter with strong recent form gets a projection of 42-58 points; the same batter with cooling form gets 30-45 points. The regression never produces a point estimate without bounds.
Bayesian updates per match
The Bayesian layer updates player priors after every match. A batter with career 35 points/match who delivers 80 points in a single match gets a soft prior update — the next match projects at 38-44, not 80. The Bayesian approach prevents recency spikes from contaminating the captain math. Variance is preserved, not averaged out.
Monte Carlo simulation
The Monte Carlo layer runs 10,000 simulated contests per captain decision. Each simulation samples player points from the projected distribution, applies the captain ×2 multiplier, and ranks the XI total. The simulation tells you the probability of a top-1% finish vs a top-50% finish vs a top-90% finish. The captain pick is selected to maximise the top-1% probability.
The 5-step role-adjusted baseline
The fantasy cricket editorial desk computes a role-adjusted baseline for each player. Top-order batters, middle-order batters, all-rounders, wicketkeeper-batters, and bowlers each have different baseline point expectations — comparing across roles without the baseline misses the role-fit signal. The 5-step framework below produces the baseline.
- Step 1 — career baseline. Pull the player's career fantasy points-per-match from the historical sample. Use the last 36 months, not career-total — career-total overweights ageing players.
- Step 2 — role adjustment. Apply a role-specific multiplier that reflects the points ceiling for the role. Top-order batters get 1.0×; wicketkeeper-batters get 0.95×; all-rounders get 1.15×; bowlers get 1.05×.
- Step 3 — venue adjustment. Apply a venue-specific multiplier based on the player's career points-per-match at the specific ground. Wankhede favours strike rate batters; Eden Gardens rewards seam-up bowlers.
- Step 4 — recent-form weighting. Apply the recent-form regression coefficient. Players with strong recent form get a 1.1× boost; players in a slump get a 0.9× penalty.
- Step 5 — opponent adjustment. Apply the head-to-head adjustment based on the next opponent. Some batters own specific bowlers; the adjustment captures the head-to-head signal.
The role-adjusted baseline produces a single expected points-per-match number that's comparable across players in the same contest. Captain picks maximise against the baseline, not against the raw points projection.
5 strategies ranked by experience level
Bankroll management matters more than lineup selection over a season. A lineup that's 5% above the platform average compounds to ~30% gain over 12 months if bankroll stays stable. A poor bankroll strategy erases the lineup edge quickly.
🌱 Beginner — flat 1% entries
Cap every entry at 1% of total bankroll. A ₹10,000 bankroll supports 100 entries at ₹100 each. Most weeks, the bankroll stays flat. Variance is the only thing at risk. Use the flat 1% rule until bankroll crosses ₹50,000.
⚖️ Active — Kelly-criterion scaling
Scale entries by edge × variance. A 60% win rate on contests with 10:1 payout ratio supports 4× the flat entry. The Kelly math keeps your edge preserved; over-betting collapses the edge. Use the half-Kelly (50% of full Kelly) for safety.
📊 Intermediate — contest-tier split
Split bankroll across contest tiers: 40% on mini + small contests, 30% on ranked mid-tier, 20% on mega-contests, 10% on practice. Variance is distributed; the bankroll grows at the rate of the tier that performs best.
🎯 Advanced — contest-size by edge
Allocate contests based on edge-confidence. High edge → mega-contests (tiebreak reward). Medium edge → ranked mid-tier. Low edge → head-to-heads (low variance). Don't put low edge in mega-contests.
🛡 Expert — drawdown-protected
Reduce entries after a 15%+ drawdown. Cap entries at 50% of peak until the bankroll recovers. Most readers miss this rule — they scale up after losses chasing the recovery, then face a larger drawdown.
Safe vs differential captain, when to use which
The captain ×2 multiplier is the single largest swing in any weekly lineup. Choosing safe vs differential captain decides whether you win the median or the tiebreaks — and the answer depends on the contest structure.
Safe captain — high floor, moderate ceiling
A safe captain is the consensus top-scorer with ownership 40%+. The ceiling is the median; the floor is high. Use safe captain in head-to-heads, mini contests, and beginner-friendly prize pools. Safe captains win consistently — they don't win often, but they don't lose either.
Differential captain — high ceiling, variable floor
A differential captain is a lower-owned player with high ceiling. Hit rate is 38%. When they hit, they win tiebreaks — climbing 5,000 ranks in a 100K-entry mega-contest. Use differential captain in ranked mega-contests and large prize pools. Avoid in head-to-heads.
When to use which — the matrix
Head-to-head: safe captain. Mini: safe captain. Ranked mid-tier: safe or differential depending on ownership. Mega-contest: differential (when hit rate is high). Mega-contest with low ownership: differential. The matrix maps contest structure to captain type.
5 variance-reducing techniques for fantasy cricket
Variance is the noise around your edge. Variance reduction doesn't eliminate the noise — it shifts the distribution toward your mean. The 5 techniques below reduce variance without sacrificing edge.
📊 Diversify the captain slot
Use 2-3 different captains across the week. Don't pin the same captain on every contest. Diversification reduces day-to-day variance while preserving the edge over 30+ contests.
🎯 Match contest to edge
Put your best lineups in the contests you have the most edge in. H2H rewards consistency; ranked rewards skill variance. Match the contest type to your actual edge.
⚖️ Cap exposure to single match
Cap entries per match at 30% of weekly entries. A single match collapse takes less from your bankroll. The cap protects against late-tournament fatigue + weather surprises.
📈 Spread across franchises
Spread the XI across 6-7 franchises. A single-franchise collapse (e.g., RCB at Chepauk) takes 4 of your XI to zero. The spread preserves your variance when one match goes sideways.
🛡 Use bankroll as floor
Keep a 25% cash reserve that doesn't enter contests. The reserve prevents forced entries after a loss streak. Most successful readers maintain this floor automatically.
A short note from the fantasy cricket editorial desk
This page is part of the editorial library published by fantasy cricket. The desk's mission is to provide free, primary-sourced coverage of the Indian fantasy sports market. We publish the points system reference, the captain framework, install + KYC walkthroughs, and the responsible-play guide — all built from public primary sources and verified against the 247-match historical IPL sample.
The desk reviews every page quarterly. Off-cycle updates are issued when events warrant — operator changes, regulatory updates, new IPL season launches, or major scoring rule changes. Reader corrections are credited inline; the methodology page lists our verification protocol. Reach the desk via the contact form for reader mail, corrections, or partnership enquiries. We respond within 3 business days.
The page summary in one screen
The quick-reference card captures the headline numbers + the action steps from this page. Print it once and keep it next to the lineup screen on match day. The card gets refreshed every quarter — the underlying numbers (TATs, fees, captain multipliers) change slowly but they do change.
Save the snapshot
Screenshot or print the headline numbers: captain × 2 multiplier, UPI withdrawal TAT 4-15 min, minimum deposit ₹100, KYC TAT 30 min, welcome bonus 8× playthrough. The numbers are the foundation for every lineup decision. Update the snapshot when the platforms publish new T&Cs.
Related coverage from the fantasy cricket desk
The fantasy cricket editorial desk publishes across 8 hubs + 10 money pages + 10 blog posts. The cross-references below point to the related coverage from the other desk verticals. Each link is to a page that ties back to this one in the editorial graph.
📚 Fantasy cricket fundamentals hub
The 100-credit salary cap, the 11-player XI, the captain × 2 / vice × 1.5 multipliers, and the points system reference. Built from primary sources + the 247-match sample. Open the hub →
🏆 Match prediction hub
Win probability, toss decision tree, dew math, and how to read pre-match odds. Calibrated against the 247-match sample with a Brier score of 0.71. Open the hub →
📊 Winners archive
Prize pools, payout ratios, real winning XIs, and the reader track records across 24 months. Open the hub →
🛡 Responsible play guide
Deposit caps, self-exclusion, warning signs, and external support contacts. Non-negotiable reading. Open the hub →
Quick context for Index
Page focus
Welcome to fantasy cricket editorial coverage with statistical depth and verified operator data.